
Page 11 - ISQ July 2022
P. 11
INVESTMENT STRATEGY QUARTERLY
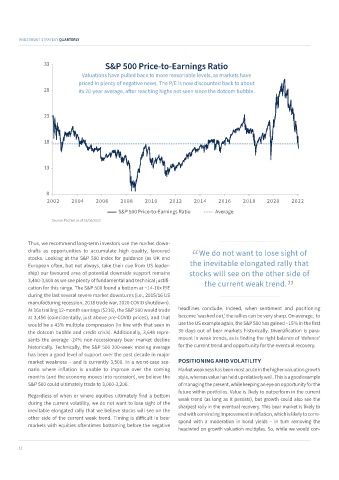
S&P 500 Price-to-Earnings Ratio
33
Valuations have pulled back to more reasonable levels, as markets have
priced in plenty of negative news. The P/E is now discounted back to about
28 its 20-year average, after reaching highs not seen since the dotcom bubble.
23
18
13
8
2002 2004 2006 2008 2010 2012 2014 2016 2018 2020 2022
S&P 500 Price-to-Earnings Ratio Average
Source: FactSet as of 21/06/2022
Thus, we recommend long-term investors use the market down-
drafts as opportunities to accumulate high quality, favoured “ We do not want to lose sight of
stocks. Looking at the S&P 500 Index for guidance (as UK and
European often, but not always, take their cue from US leader- the inevitable elongated rally that
ship) our favoured area of potential downside support remains stocks will see on the other side of
3,400-3,600 as we see plenty of fundamental and technical justifi- the current weak trend.
cation for this range. The S&P 500 found a bottom at ~14-16x P/E ”
during the last several severe market downturns (i.e., 2015/16 US
manufacturing recession, 2018 trade war, 2020 COVID shutdown).
At 16x trailing 12-month earnings ($216), the S&P 500 would trade headlines conclude. Indeed, when sentiment and positioning
at 3,456 (coincidentally, just above pre-COVID prices), and that become ‘washed out,’ the rallies can be very sharp. On average, to
would be a 43% multiple compression (in line with that seen in use the US example again, the S&P 500 has gained ~15% in the first
the dotcom bubble and credit crisis). Additionally, 3,648 repre- 30 days out of bear markets historically. Diversification is para-
sents the average -24% non-recessionary bear market decline mount in weak trends, as is finding the right balance of ‘defence’
historically. Technically, the S&P 500 200-week moving average for the current trend and opportunity for the eventual recovery.
has been a good level of support over the past decade in major
market weakness – and is currently 3,500. In a worst-case sce- POSITIONING AMID VOLATILITY
nario where inflation is unable to improve over the coming Market weakness has been most acute in the higher-valuation growth
months (and the economy moves into recession), we believe the style, whereas value has held up relatively well. This is a good example
S&P 500 could ultimately trade to 3,000-3,200. of managing the present, while keeping an eye on opportunity for the
future within portfolios. Value is likely to outperform in the current
Regardless of when or where equities ultimately find a bottom weak trend (as long as it persists), but growth could also see the
during the current volatility, we do not want to lose sight of the sharpest rally in the eventual recovery. This bear market is likely to
inevitable elongated rally that we believe stocks will see on the end with convincing improvement in inflation, which is likely to corre-
other side of the current weak trend. Timing is difficult in bear spond with a moderation in bond yields – in turn removing the
markets with equities oftentimes bottoming before the negative
headwind on growth valuation multiples. So, while we would con-
11