
Page 15 - ISQ UK_October 2017
P. 15
OCTOBER 2018
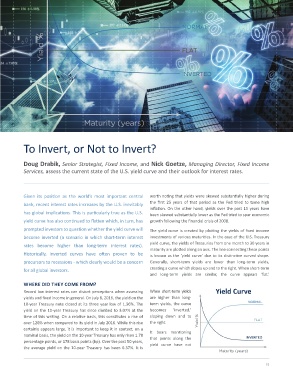
To Invert, or Not to Invert?
Doug Drabik, Senior Strategist, Fixed Income, and Nick Goetze, Managing Director, Fixed Income
Services, assess the current state of the U.S. yield curve and their outlook for interest rates.
Given its position as the world’s most important central worth noting that yields were skewed substantially higher during
bank, recent interest rates increases by the U.S. inevitably the first 25 years of that period as the Fed tried to tame high
inflation. On the other hand, yields over the past 15 years have
has global implications. This is particularly true as the U.S. been skewed substantially lower as the Fed tried to spur economic
yield curve has also continued to flatten which, in turn, has growth following the financial crisis of 2008.
prompted investors to question whether the yield curve will The yield curve is created by plotting the yields of fixed income
become inverted (a scenario in which short-term interest investments of various maturities. In the case of the U.S. Treasury
rates become higher than long-term interest rates). yield curve, the yields of Treasuries from one month to 30 years in
maturity are plotted along an axis. The line connecting these points
Historically, inverted curves have often proven to be is known as the ‘yield curve’ due to its distinctive curved shape.
precursors to recessions - which clearly would be a concern Generally, short-term yields are lower than long-term yields,
for all global investors. creating a curve which slopes up and to the right. When short-term
and long-term yields are similar, the curve appears ‘flat.’
WHERE DID THEY COME FROM?
Record low interest rates can distort perceptions when assessing When short-term yields Yield Curve
yields and fixed income in general. On July 8, 2016, the yield on the are higher than long-
10-year Treasury note closed at its three year low of 1.36%. The term yields, the curve NORMAL
yield on the 10-year Treasury has since climbed to 3.07% at the becomes ‘inverted,’
time of this writing. On a relative basis, this constitutes a rise of sloping down and to
over 126% when compared to its yield in July 2016. While this rise the right. Yield % FLAT
certainly appears large, it is important to keep it in context; on a It bears mentioning
nominal basis, the yield on the 10-year Treasury has only risen 1.78 that points along the INVERTED
percentage points, or 178 basis points (bp). Over the past 50 years, yield curve have not
the average yield on the 10-year Treasury has been 6.37%. It is
Maturity (years)
15