
Page 13 - ISQ UK_October 2017
P. 13
JANUARY 2022
now moving away from their zero-tolerance COVID policies. As fac- the challenges, the port of Los Angeles continues to process a
tories across Asia revved up, supply chain constraints have started record amount of cargo volume, the number of import containers
to ease. This is an important, yet understated, part of the supply sitting on the docks has fallen over 30% since late October and
chain story given China and the ASEAN region’s dominant position incoming traffic continues to fall. With seasonal volumes expected
in global trade. to slow further between now and early next year, the logjams at
the ports should continue to ease.
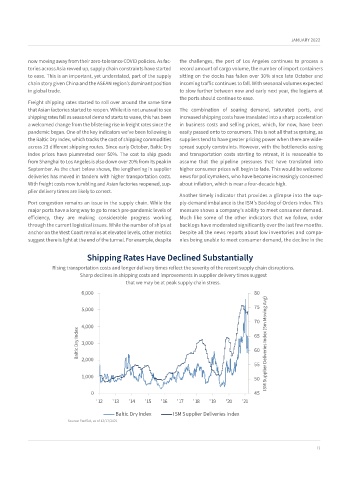
Freight shipping rates started to roll over around the same time
that Asian factories started to reopen. While it is not unusual to see The combination of soaring demand, saturated ports, and
shipping rates fall as seasonal demand starts to wane, this has been increased shipping costs have translated into a sharp acceleration
a welcomed change from the blistering rise in freight rates since the in business costs and selling prices, which, for now, have been
pandemic began. One of the key indicators we’ve been following is easily passed onto to consumers. This is not all that surprising, as
the Baltic Dry Index, which tracks the cost of shipping commodities suppliers tend to have greater pricing power when there are wide-
across 23 different shipping routes. Since early October, Baltic Dry spread supply constraints. However, with the bottlenecks easing
Index prices have plummeted over 50%. The cost to ship goods and transportation costs starting to retreat, it is reasonable to
from Shanghai to Los Angeles is also down over 20% from its peak in assume that the pipeline pressures that have translated into
September. As the chart below shows, the lengthening in supplier higher consumer prices will begin to fade. This would be welcome
deliveries has moved in tandem with higher transportation costs. news for policymakers, who have become increasingly concerned
With freight costs now tumbling and Asian factories reopened, sup- about inflation, which is near a four-decade high.
plier delivery times are likely to correct.
Another timely indicator that provides a glimpse into the sup-
Port congestion remains an issue in the supply chain. While the ply-demand imbalance is the ISM’s Backlog of Orders Index. This
major ports have a long way to go to reach pre-pandemic levels of measure shows a company’s ability to meet consumer demand.
efficiency, they are making considerable progress working Much like some of the other indicators that we follow, order
through the current logistical issues. While the number of ships at backlogs have moderated significantly over the last few months.
anchor on the West Coast remains at elevated levels, other metrics Despite all the news reports about low inventories and compa-
suggest there is light at the end of the tunnel. For example, despite nies being unable to meet consumer demand, the decline in the
Shipping Rates Have Declined Substantially
Rising transportation costs and longer delivery times reflect the severity of the recent supply chain disruptions.
Sharp declines in shipping costs and improvements in supplier delivery times suggest
that we may be at peak supply chain stress.
6,000 80
5,000 75
70
4,000
Baltic Dry Index 3,000 65 ISM Supplier Deliveries Index (5m Moving Avg)
60
2,000
55
1,000 50
0 45
'12 '13 '14 '15 '16 '17 '18 '19 '20 '21
Baltic Dry Index ISM Supplier Deliveries Index
Source: FactSet, as of 12/17/2021
13